Save Time with Chrome DevTools
16 Sep 2013Lately, I’ve been writing code and debugging while sharing my screen on conference calls. I needed to find a reliable, easy way to make everything visible on screen, and keep it manageable for me at the same time. Jumping back and forth between a browser and Sublime Text may work fine solo, but it can give an audience vertigo pretty quickly.
I tried a few different ways to write code directly in the browser instead of a text editor. If you spend a lot of time in DevTools or at the console prompt, you might find these useful as well. I found that a few simple tricks like these can save a lot of time by the end of a long week.
Instant Chrome Scratch Pad
I started by using a simple bookmarklet that applies contentEditable to the body of a new Chrome tab. There are a many versions of this floating around online, but the settings I found most readable are:
data:text/html, <title>Text Editor</title><body contenteditable style="font-size:1.3rem;line-height:1.5;max-width:60rem;margin:0 auto;padding:3rem;font-family:Inconsolata-dz,monospace">Try copying that text and pasting it into the address bar in Chrome, just like it was a Web page URL, and then hit enter. If you click in the body of the browser tab (or window), you can now type whatever you want directly on the page. Pretty cool if you haven’t tried it before. The whole tab becomes a scratch pad that’s easy for other folks to see, or just for you to write a quick note to yourself without leaving Chrome.
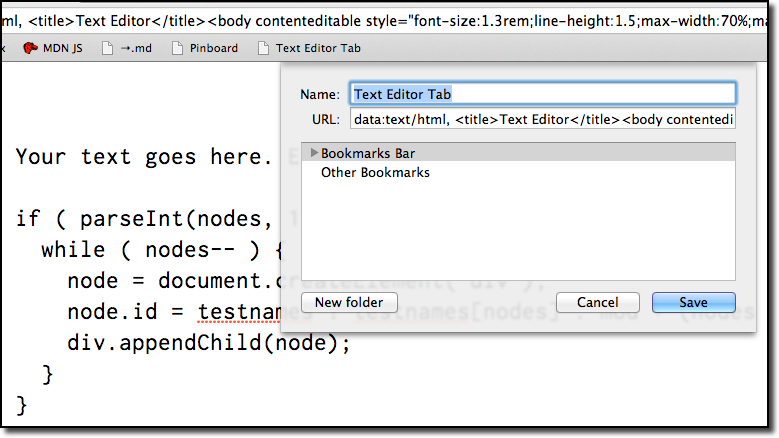
To make this convenient, just copy that text and paste it into a new bookmark on your bookmarks bar. Here’s how: First, right click on the bookmarks bar and select “Add Page”. Then just paste that code into the “URL” field. Fill in a name, like “Text Editor Tab” and click “Save”. Now whenever you need it, just Cmd + t for a new tab, click that bookmark, click in the body and type away. One thing to note: you can’t save the tab content directly to disk. If you refresh the tab, or close Chrome, your text is toast. Still good for a quick place to jot things down, especially if other people need to see it on the screen.
Full Code Editor in a Tab
Next, I tried using one of the code editors that run right in the browser, like Ace and Codemirror. I set up a folder in Dropbox for Ace and copied the downloaded files there. Then I opened the editor.html file in Chrome and saved it as a bookmark. It gives you a pretty full-featured code editor right in Chrome. Plenty of features are available with both Ace and Codemirror.
Both of these JavaScript based code editors can be embedded in pages and applications. The new open source code editor Brackets from Adobe, Codepen.io, Code School, Emmet, jsbin, JSHint and many other projects use Codemirror as their editor.
The syntax highlighting I got from Ace was definitely an improvement over the plain text editable tab since everyone could see the code better. But I was thinking it would be really nice to edit and save code right frome the browser.
Live Edit Source Files and Workspaces
In the Chrome DevTools, we can edit stylesheets and script files right in the browser and see changes updated in the page without a refresh. Live CSS and script editing like this makes the changes visible on the page right away, which saves a ton of time by avoiding jumps out and back to a text editor a million times a day.
JavaScript Edits
JavaScript editing happens on the Sources panel. From the Elements panel, just click the link to the script you want. That brings the script file up in the editor in the Sources tab. One click, and we’re ready to make our changes. Nice.
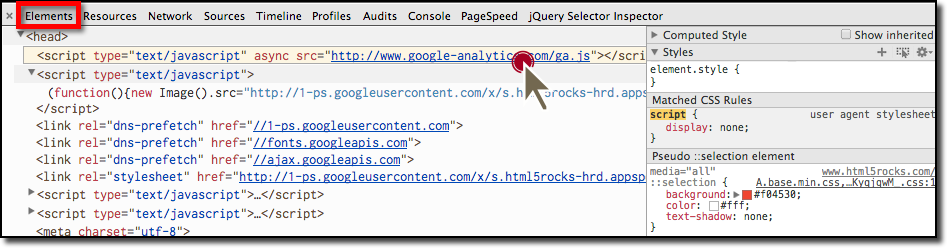
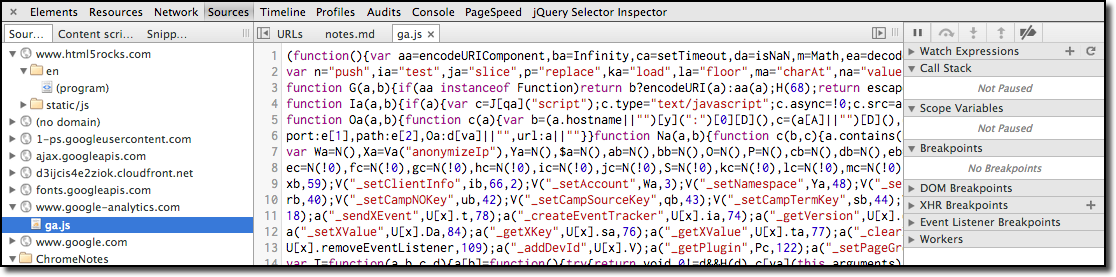
Clicking the script link from the Elements panel above brings you to that script in the editor in the Sources panel:
There’s some good info on debugging in the Sources panel in the DevTools docs.
Now we’re editing our script files right in the Chrome DevTools and seeing most of the changes live, without a page refresh. Changes to script code that’s not running after load won’t take effect immediately, but changes to code that executes later like click handlers can be tested right away.
CSS Edits
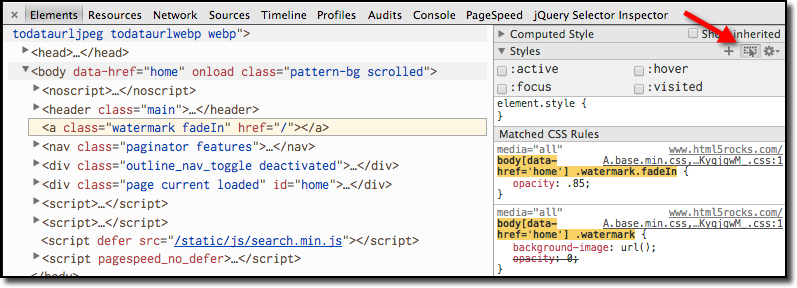
To edit CSS, from the Elements panel, select the Styles sub-panel on the right. Changes we make there are reflected right on the page. You can even trigger different anchor states with the little hover icon:
Saving Changes
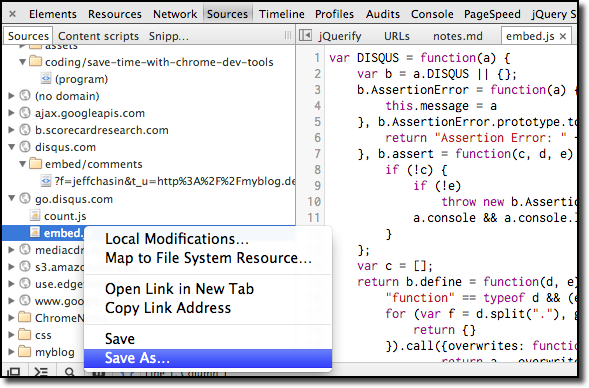
Seeing changes happen live on the page is huge, but saving those changes right from DevTools to the source file is awesome. From the text editor view on the Sources tab, just right click on the file name in the sources pane on the left, or in the text editor on the right, and choose “Save As”. Nice. After the first “Save As”, we can just Cmd + S to save additional changes to those files.
Revision History
Not only can we save changes without leaving DevTools, Chrome also saves a revision history of all our changes on local files. After making some edits like those we’ve discussed, you can right click on a file name in the Sources tab, or on the open file in the text editor, and click “Local Modifications” to see the change history. It shows a diff of the changes with the option to revert to a specific previous change, or just go back to the orginal state of the file.
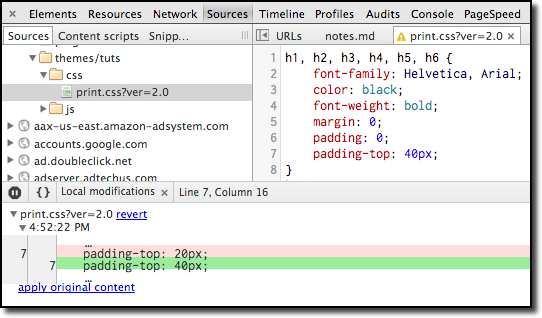
For me, this is great because I can try things, break things, hack on things locally, and not have to worry about climbing back out of the rabbit hole, I can just revert changes that don’t work out. In the image above, we see my change of the padding-top CSS declaration from 20px to 40px, with the option to revert the change.
Workspaces - Project Folders in DevTools
Workspaces in Chrome DevTools lets you map resources from a local web server to your disk files. Translation: you can edit almost any kind of source file and save those changes to the appropriate file - just like we did with CSS and JavaScript files above. HTML, Markdown, Ruby, any code or text-based file can be edited and saved without leaving the browser.
If that last line didn’t get your attention, you’re reading the wrong blog post :-)
Here’s a real quick example. I have two computers that I use regularly, one from work and one personal. Many times, I’ll remember something I need to do next time I’m on the other machine, so I make a quick note to myself not to forget. Now, using workspaces, I don’t even have to leave Chrome, I just hit Cmd + Option + I to bring up DevTools, and my “Notes.md” markdown file is right there. Since I mapped it to Dropbox, it’s a real easy way to get to it from anywhere, again without leaving Chrome.
This is just a quick example, the real benefit to this comes when we’re working on a site or application and we can try changes live, save them to disk, revert them if needed, and have most of our workflow right in the browser. If the Chrome DevTools team keeps up their pace, I imagine we’ll have more really cool IDE features added in the future.
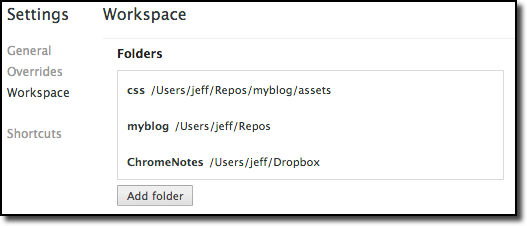
To enable workspaces, just open DevTools and hit the question mark, or click the little gear icon all the way over to the lower right corner of the DevTools window. This is the Settings panel and clicking on the “Workspace” link in the left column lets us add a folder or several folders that will be mapped to DevTools. Click the “Add folder” button and select which folder you’ll use for your project. You may see a permissions request at the top of the screen, just click “OK” to enable this.
We can also map that folder to a URL to have Chrome load the workspace folder contents instead of the network folder contents. This article from HTML5Rocks has the details.
Custom JavaScript Snippets in DevTools
There’s one more handy feature I discovered here that’s a real time saver. If we have small scripts, bookmarklets or utility functions we use often, we can save them right into DevTools as snippets.
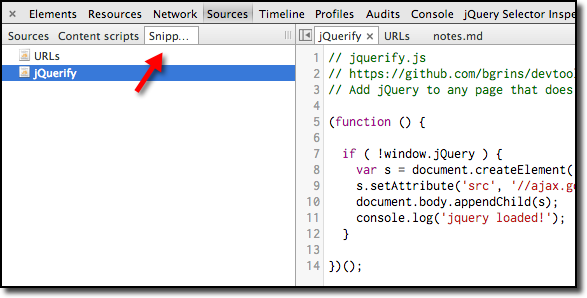
Open the DevTools panel with Cmd + Option + I and click on the Sources tab. In the left column you should see “Sources”, “Content scripts”, and “Snippets”. If you can’t see them, you may need to expand the left pane with the little icon:
If you right click in the Snippets pane on the left and choose “New”, you can name your snippet file, then just enter the code snippet in the editor window to the right and Cmd + S to save. When you’re working in the console, you can use any of these snippets with a quick function call. There are libraries of debugging helpers, and repos of snippets for developers to find code and ideas to add to your own collection. If you work in the DevTools console often, this is another big time saver.
Themes for Chrome Developer Tools
Syntax highlighting is common because it makes reading code much easier for most people. There is a growing collection of theme designs - colors, fonts, line-spacing, etc. - that make it much easier to read when we’re working in DevTools.
devthemes has a cool collection and also includes themes for TextMate and Sublime Text. I’m using the Readable theme with a few tweaks. You can see screenshots of that theme or download it from Github.
More themes (or skins) are listed in this article.
Hope you found a useful trick or two here. If you have questions or comments, please let me know, or give a shout on Twitter @JeffChasin.